
A Study on the Indicators of Nutritional Status of Children of Historically Disadvantaged Agri-Business Families in South Africa
Awonke Sonandi*, ElliotMahlengule Zwane, Johan Adam Van Niekerk
Centre for Sustainable Agriculture, Rural Development and Extension; University of the Free State, Bloemfontein, 9301, South Africa
Received Date: 28 August, 2018; Accepted Date: 04 September, 2018; Published Date: 12 September, 2018
*Corresponding author: Awonke Sonandi, Centre for Sustainable Agriculture, Rural Development and Extension; University of the Free State, Bloemfontein, 9301, South Africa. Tel: +27(0)713318614; Email: Awonke.sonandi@drdar.gov.za
Citation: Sonandi A, Zwane EM, Niekerk JAV (2018) A Study on the Indicators of Nutritional Status of Children of Historically Disadvantaged Agri-Business Families in South Africa. Adv Nutri and Food Scie: ANAFS-110.
Abstract
Background: There is scarce information on the nutritional status of children of historically disadvantaged agri-business smallholders.
Objective: To evaluate the nutritional status of children from historically disadvantaged agri-business families.
Methodology: The study’s purposeful sample comprised of 263 agri-business households that generated an annual turnover of $11 811 – $39 370, and 327 children aged 5-14 years. A 3-day 24h dietary recall method was administered and questionnaires were used to assess the households’ socio-economic status, and the caregivers’ nutritional knowledge, and practices. Food models and Food finder III nutritional software were used to improve the accuracy of recorded food quantities. Statistical Package for Social Sciences, Version 20, was used for statistical analyses.
Results: Generally, the agri-business households had modest feeding practices. The majority of their households had a monthly non-farm income of $78.82 – $118.11 (32.9%), and monthly food expenditure of $55.20 – $70.87 (23.2%).The average annual farm income payable to each agri-business smallholder was $2 903.The mean food variety score was low at 23.431±7.89, while the mean dietary diversity score was debatably high at 7.82±4.53.The households’ non-farm income was positively highly correlated to food expenditure (p<0.01).In turn, food expenditure had a significant influence on food variety score (p<0.01) and dietary diversity score (p<0.05).The majority of children had normal weight-to-age (80.14%), normal height-to-age (90.7%) and normal body mass index-for-age Z-scores (56.57%).However, the risk of overweight, the actual overweight and obesity were a concern as they were evident among 36.39%, 6% and 8% of the children, respectively.
Conclusion: The agri-business families consumed meals that were predominantly carbohydrates-based, and had low food variety score and debatably high dietary diversity score. The majority of children had normal anthropometric dimensions that were indicative of good nutritional status. However, overweight / obesity appeared a creeping problem than is stunting and wasting.
Keywords: Anthropometric Parameters; Children; DDS; FVS; Nutritional Knowledge; Nutritional Status
Background
Since the dawn of the democratic South Africa in 1994, the subject of food security has received serious attention in many civil society, academic and government circles. This attention which led to the formulation of South Africa’s Integrated Food Security Strategy (IFSS)[[i]] was prompted by the dire need to address food insecurity concerns of many previously disadvantaged families, particularly those who reside in poverty-stricken rural areas of South Africa. Subsequent to the inception of the IFSS, the country introduced a number of food security-based agricultural programmes that sought to benefit mainly the previously disadvantaged smallholder agri-business families. A number of local food security studies were conducted on these smallholder families. However, many of them tended to put either little emphasis or none on the nutrition facet of food security[[ii], [iii],[iv],[v],[vi]]. Instead, children of smallholder farmers are presumed nutrition secured or having an elevated nutritional status by virtue of being dependants of food producers. One’s food security status is no guarantee to achieving good nutritional status. Nevertheless, in other parts of the world, the nutrition dimension of food security receive due attention[[vii]] Research in the nutrition facet covers indicators of nutritional status or nutrition security such as food variety and dietary diversity[[viii],[ix]], and anthropometric parameters[[x],[xi]].These indicators formed part of the investigation in the current study.
In the light of the above gaps, this study posed the following research questions:
- To what extent are children from agri-business family’s nutrition secured?
- Alternatively, what is the nutritional status of children from agri-business families?
- What key socio-economic attributes influence nutrition security or nutritional status of children from agri-business families?
That is:
- Is there a relationship between an agri-business family’s non-farm income and its children’s nutritional status?
- Is there a relationship between an agri-business family’s food expenditure and its children’s nutritional status?
- Is there a relationship between an agri-business family’s farm income and its children’s nutritional status?
- Is there a relationship between a caregiver’s educational qualifications and his/her children’s nutritional status?
The purpose of this study was to make an investigation into the nutritional status of children from historically disadvantaged agri-business families, and key socio-economic attributes that influence the children’s nutritional status. Its specific objectives were to; a) establish a baseline data for the nutritional status of children from agri-business families, and b) establish the extent to which children from agri-business families are nutrition secured, using a multiple of scientifically proven research methods of measuring nutritional security.
Methodology
Study Population and Sampling: The study population was agri-business families who operate and reside in Umzimvubu and Ntabankulu Local Municipalities of Alfred Nzo District Municipality in the Eastern Cape Province, South Africa. Specifically, it targeted previously disadvantaged smallholder agri-business families whose individual or collective annual turnover is between $11 811 and $39 370.All families who met this criterion were purposefully selected from a farmer database that was made available by local agricultural extension officers. Subsequent to the exclusion of survivalist farming families (annual turnover less than $11 811)this study included the whole remaining purposeful research sample of 263 agri-business families, and 327 children aged 5-14 years. From each of the 263 farming households, questions that relate to nutritional knowledge, attitudes and feeding and general care of children were directed to caregivers who lived in these households.
Research Methods
Socio-Economic and Nutrition Questionnaires: Questionnaires were used to assess the caregivers’ socio-economic status, and feeding practices. A 24h dietary recall questionnaire was administered twice in weekdays and once in weekends. This is a retrospective quantitative method that is used in nutritional assessment. It entails asking individuals to recall foods and drinks they had consumed over the previous 24h period prior to the interview [[xii]]. The advantages of a 24h method are well articulated by these authors. Among them and of particular relevance to this study, is that this method can be used to determine food variety scores (FVS) and dietary diversity scores (DDS). The former is the number of food items consumed over a period of time, while the latter refers to the number of food groups consumed over a period of time [[xiii]]. DDS for agri-business families were calculated so as to shed light on the dietary quality of foods and drinks consumed [[xiv]]. Food models and the internationally acclaimed Food finder III nutritional software of the Medical Research Council of South Africa were used to improve the accuracy of recorded food quantities.
Anthropometric Measurements: Anthropometry is the measurement of body weight, height and proportions which is widely used in conducting clinical examinations in various groups of population, including children [[xv]]. Prior to taking anthropometric measurements in this study, the researcher and fieldworkers received training from public health workers on measurement of weight and height of the caregivers’ children in order to determine anthropometric measurements. Accordingly, a calibrated electronic scale was used to measure weight. All the children were weighed with their shoes and socks being removed, and with their light clothes put on. Two weight readings were taken within the nearest 0.1kg, and the average of the two readings was recorded if the two readings were different. Height was measured with a stadiometer, with vertical scale of metres and a sliding headpiece, to the nearest 0.1cm.Children had to put their legs and knees straight together with arms aside, and feet and heels touching together. As with weight, two measurements were taken, and the average recorded if the two measurements were different.
Weight and height recordings were captured on Excel, and the following anthropometric measurements determined on WHO Anthro V3.2.2 and Anthrop us V1.0.4 software’s, namely; weight-for-age Z-scores (WAZ), height-for-age Z-scores(HAZ) and body mass index-for-age Z-scores (BMIZ).WAZ, which is measured in children that are younger than nine years[xi] was confined to 146 children aged 5-8 years in this study. MBIZ was calculated as, weight/height2.The classification of the children’s Z-scores of WAZ, HAZ and BMIZ was done in accordance with WHO [xv].
Data Analysis: Data was cleaned and statistically analysed using Statistical Package for Social Sciences (SPSS), Version 20.Descriptive statistics was performed to establish central tendencies. On-parametric Kruskal-Wallis H test was conducted in order to elucidate the outcomes of the parametric tests, and a bivariate correlation analysis was conducted to describe relationships between variables.
Ethical Considerations: The researcher obtained consent from the caregivers to conduct the study. Their right to anonymity, confidentiality and fair treatment was respected. This study also upheld scientific integrity.
Results
Socio-Economic Information
Demographic Characteristics: Most of the caregivers who participated in this study were women (n=250, 94.95%), the majority of which were aged 36-40 years (n=54, 20.5%), followed by those aged 46-50 years (n=36, 13.7%).Their children were aged 5-14 years, the majority of which were male (n=177, 45.13%).The caregivers’ level of education was low; the majority having acquired Grade 8-11 (n=66, 25.1%), while some never had any formal education (n=41, 15.6. Most caregivers permanently lived with 4-6 persons (n=109, 41.4%), while the majority (n=143, 55.4%) had no employed family members among those that they permanently live with.
Economic Characteristics: The main sources of non-farm income of households were wages / salaries of employed family members, government social grants and remittances. The households had a modest monthly non-farm income; the majority earning$78.82-$118.11 (n=85, 32.9%).A minimum monthly non-farm income of$39.37 – $78.74 was earned by 21.3% of the households, while a maximum of more than $196.85 (19.8%) was earned by 19.8%.Monthly non-farm income was positively strongly correlated to food expenditure (r=0.55, p<0.01).
The farming activities of the agri-business smallholders were not intense, often characterized by low yields and productivity due to use of outdated farming methods and poor infrastructure base. The majority of the smallholders (n=236, 89.73%) co-owned and / or co-managed their agri-business units in groups; the average size of a group being four people. The average annual farm income payable to each agri-business smallholder was $2 903.However, in their homesteads the agribusiness smallholders kept some livestock and grew crops which were used for home consumption, mainly.
Nutritional knowledge: In the current study, the caregivers’ nutritional knowledge was assessed on areas of namely; breakfast patterns, frequency and variety of meals consumed per day, and ability to judge their children’s basic anthropometric conditions.
Breakfast Eating Patterns: In this study, caregivers were asked some opinion seeking questions on breakfast eating patterns, the responses of which are captured in Table 1.When asked for an opinion on whether it is a good nutritional practice to provide breakfast to their children before they go to school or church, the majority of the caregivers responded in the `affirmative’ (n=227, 86.3%), while a few (n=8, 3.%) said such practice was not good Subsequently, the caregivers were asked if it is economically difficult to provide breakfast to their children before they go to school or church. Most caregivers acknowledged such economic difficulty (n=153, 58.2%), while 106 (40.3%) said it was not difficult. Commonly mentioned sources of economic difficulties in providing breakfast included expensive electricity, and expensive food materials that make a nutritious breakfast. With respect to the frequency of providing breakfast to their children, about half of the caregivers (n=132, 50.2%) said the provision of breakfast is made every day of the week, followed by those who reportedly provided breakfast four to six times a week (n=82, 31.2%).
| Characteristics | Frequency (n=263 | Percentage (%) |
| Is Provision Of Breakfast A Good Practice? | ||
| Good | 227 | 86.3 |
| Not good | 8 | 3 |
| Do not know | 28 | 10.6 |
| Is It Difficult To Provide Breakfast? | ||
| Difficult | 153 | 58.2 |
| Not difficult | 106 | 40.3 |
| Do not know | 4 | 1.5 |
| Frequency Of Provision Of Breakfast | ||
| Every day | 132 | 50.2 |
| 4-6 times per week | 82 | 31.2 |
| 1-3 times per week | 26 | 9.9 |
| Never | 23 | 8.7 |
Frequency and Diversity of Meals: A similar line of questions were posed to the caregivers regarding their opinion on the practice of providing their children with three meals a day and a snack in between. To this end, many said this was a good practice (n=222, 84.4%), while the rest reported either `not good’ (n=10, 3.8%) or `do not know’ (n=31, 11.8%). Those who responded in the affirmative felt that this nutritional practice would make their children; grow fast, and perform well at school. In reality, a smaller number of caregivers (n=104, 39%) said they are affording to provide their children with three meals a day and snacks in
between, while the rest (n=159, 60.5%) indicated that they are not affording.
| Characteristics | Frequency (n=263) | Percentage (%) |
| Is It A Good Practice? | ||
| Good | 222 | 84.4 |
| Not good | 10 | 3.8 |
| Do not know | 31 | 11.8 |
| Is It A Difficult Practice? | ||
| Difficult | 138 | 52.5 |
| Not difficult | 125 | 47.5 |
| Is Provision Of Variety In Meals A Good Practice? | ||
| Good | 244 | 92.8 |
| Not good | 10 | 3.8 |
| Do not know | 9 | 3.4 |
| Is Provision Of Variety In Meals A Difficult Practice? | ||
| Difficult | 139 | 52.9 |
| Not difficult | 124 | 47.1 |
| Do not know | 0 | 0 |
This study also sought to make a brief assessment of nutritional knowledge and attitudes of the caregivers on the importance of providing their children with different types of meals. When asked to share their opinion on this nutritional practice, the overwhelming majority said this practice was good(n=244, 92.8%), followed by those who said they do not know’ (n=10, 3.8%) (Table 2). The commonly cited reasons given for providing different types of meals were; children do get tired of eating the same food all the time, and different meals provide a wide range of nutrients that are needed by the body notwithstanding the above responses on the diversity of meals, more than half of the caregivers (n=139, 52.9%) said in reality it was difficult to provide their children with different types of foods (Table 2).Cited causes of this difficulty were; expensive prices of food, and unavailability of some foodstuffs in the local shops.
Food Intake, Food Variety and Dietary Diversity
Food Intake
Table 3 presents a summary of top 20 most consumed food items by the caregivers’ children during the 3-day 24h dietary recall. Noticeably, the carbohydrates-rich food items from the `cereal, roots and tubers’ group dominated the top 10 most consumed foods. From the `flesh’ and `dairy products’ groups, only canned fish and chickens, and fresh milk and sour milk, respectively, appeared in the list of top 20 most consumed foods items. Only carrots and spinach from the `vitamin A-rich vegetables and fruits’ group, and cabbage and onion from the `other vegetables’ group appeared in the list presented in Table 3, while sunflower oil represented the `fats and oils’ group. Food groups whose food items did not feature in the list in question were `eggs’, `legumes and nuts’, and `other fruits and juices’ groups.
This study also found that consumed quantities of food items varied widely within and between households, largely due to the varying socio-economic profiles of the caregivers’ households. Consumed quantities of food items from other food groups were rather low (e.g. dairy products, vegetables, and flesh foods).Again, this appeared a function of socio-economic properties of the caregivers’ households, which have been discussed earlier in this paper.
| Rank | Food item | Mean food intake (g/person/day) |
| 1 | Maize meal soft porridge | 99.23±74.56 |
| 2 | Instant tea | 182.14±131.38 |
| 3 | White sugar | 19.99±7.05 |
| 4 | Maize meal stiff pap | 123.49±72.79 |
| 5 | Brown bread/rolls | 27.58±30.81 |
| 6 | Amarhewu | 176.78±174.66 |
| 7 | Crumbed maize meal (uphuthu) | 107.67±105.07 |
| 8 | Fresh milk | 21.85±26.34 |
| 9 | Potatoes | 21.38±14.34 |
| 10 | Samp | 156.63±139.91 |
| 11 | Rice | 64.86±36.03 |
| 12 | Sour milk | 128.57±118.77 |
| 13 | Carrot | 14.28±10.94 |
| 14 | Baked bread, homemade | 49.16±50.43 |
| 15 | Cabbage | 10.64±12.47 |
| 16 | Spinach | 10.17±14.89 |
| 17 | Onion | 8.78±11.74 |
| 18 | Sunflower oil | 23.85±32.99 |
| 19 | Canned fish | 13.66±17.56 |
| 20 | Chicken | 33.81±39.95 |
Food Variety and Dietary Diversity: The average FVS for the 263 investigated households were low at 23.43 (see Table 4).Most of the caregivers’ households (n = 215; 81.7%) had a low FVS, followed by those with a medium FVS (n = 48; 18.3%). None of the households had a high FVS category (see Figure 1).Regarding dietary diversity, most of the caregivers’ households (n = 88; 33.5%) consumed foods from eight food groups, followed by those (n = 71; 27.0%) who consumed foods from all nine foods groups. Three food groups was the lowest number consumed (n = 5; 1.9%).The mean dietary diversity score (DDS) was 7.82, which is indicative of a high DDS. The majority of the caregivers’ households (n = 184; 70%) had high DDS (see Figure 2), followed by those with medium DDS (37.2%) and low DDS (8.2%).
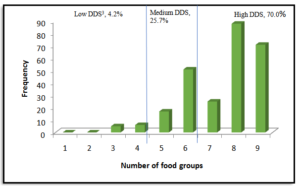
Figure 1: Distribution of food variety scores from the caregivers’ households
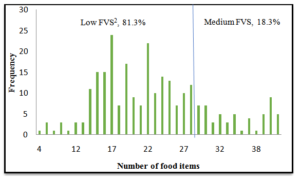
Figure 2: Distribution of dietary diversity scores from the caregivers’ households.
Food Group |
Mean | SD[1] | Range |
| Cereal, roots and tubers | 5.05 | 0.89 | 7-Mar |
| Fleshy foods | 3.22 | 1.08 | 5-Jan |
| Dairy products | 1.97 | 1.14 | 0-6 |
| Legumes and nuts | 1 | 0.58 | 0-3 |
| Eggs | 0.38 | 0.49 | 0-1 |
| Vitamin A-rich vegetables and fruits | 3.06 | 1.2 | 0-5 |
| Other fruits and juices | 2.85 | 1.93 | 0-8 |
| Other vegetables | 4.03 | 2.48 | 0-11 |
| Fats and oils | 1.86 | 0.86 | 0-4 |
| Total Food Items | 23.43 |
Anthropometric Parameters
N WAZ, HAZ and BMIZ: As indicated earlier, the measurement of WAZ was limited only to 146 children of 5-8 years of age. Of these children, the majority (80.14%) had normal WAZ (<-1SD to <0SD), while the remaining minority (19.86%) were underweight (≥-3SD to <-2SD) [Table 5].The prevalence of underweight was higher among male children than in their female counterparts (p≤0.05).Of the 327 children who were subjected to the HAZ measurement, the overwhelming majority (90.70%) had normal HAZ (>-1SD to +3SD).The rest who were stunting (<-2SD), particularly female children (p≥0.05).The measurement of BMIZ was also extended to all 327 children. Over half (56.57%) of the children included in this study had normal BMIZ (>-2SD to <+1SD), and a very small proportion (0.92%) was wasting (<-2SD to >-3SD).Of concern was a creeping problem of over-nutrition. To this end, 36.39% of children were at risk of overweight (>+1SD to <+2SD), while 6% and 8% were overweight (>+2SD to <+3SD) and obese (>+3SD), respectively. Noticeably, female children were heavier than their male counterparts of the same age (p≥0.05).The caregivers were given an opportunity to visually appraise the body condition of their children in a scale of underweight, normal weight, overweight and obese. In their responses, most of the caregivers rated the weight of their children as normal (n=221, 84%), followed by those who rated them underweight (n=29, 11%), overweight (n=1, 0.4%) and obese (n=12, 4.6%).
Abbreviation:
WAZ: Weight-for-age
HAZ: Height-for-age
BMIZ: Body mass index-for-age Z score
| Classification | Z-score | Gender | Total | |
| Male | Female | |||
| WAZ2(n=146) | ||||
| Severely underweight | <-3SD | 0 | 0 | 0 |
| Underweight | ≥-3SD to <-2SD | 17 (17.71%) | 12 (24.00%) | 29 (19.86%) |
| Normal WAZ | <-1SD to <0SD | 79 (82.29%) | 38 (76.00%) | 117 (80.14%) |
| HAZ1n=327) | ||||
| Severely stunting | <-3SD | 0 | 0 | 0 |
| Stunting | <-2SD | 13 (7.34%) | 17 (11.33%) | 30 (9.30%) |
| Normal HAZ | <-1SD to +3SD | 164 (92.66%) | 133(88.67%) | 297 (90.7%) |
| BMIZ4(n=327) | ||||
| Severely wasting | <-3SD | 0 | 0 | 0 |
| Wasting | <-2SD to >-3SD | 2 (1.13%) | 1 (0.67%) | 3 (0.92%) |
| [1][1][1]Normal BMIZ | >-2SD to <+1SD | 117 (66.10%) | 68 (45.33%) | 185 (56.57%) |
| Risk of overweight | >+1SD to<+2SD | 52 (29.38%) | 67 (44.67%) | 119 (36.39%) |
| Overweight | >+2SD to<+3SD | 2 (1.13%) | 6 (4.00%) | 8 (2.45%) |
| Obese | >+3SD | 4 (2.26%) | 8 (5.33%) | 12 (3.67%) |
| SD : Standard Deviation
WAZ : Weight-for-age HAZ : Height-for-age BMIZ : Body mass index-for-age Z score |
||||
Factors Affecting Nutritional Status: Hypothetical tests were conducted on key factors that were deemed influential in the children’s anthropometric parameters, namely; WAZ, HAZ and BMIZ. These key factors were monthly non-farm income, monthly food expenditure, farm income, and the caregivers’ level of education and breakfast patterns. All these key factors, with the exception of breakfast patterns, had an influence (p≤0.01) on the children’s WAZ, HAZ and BMIZ. The influence of breakfast patterns on the children’s anthropometric parameters was rather non-significant (p≥0.05).
Discussion: The size of the caregivers’ households was investigated, because of its potential effect on the nutritional status of habitants of the households. It was found comparable with the average size of households of 3.7 and 3.9 at Alfred Nzo District and Eastern Cape Province, respectively. Also comparable was the unemployment rate among adult habitants of the studied households. Nutritional knowledge can play a pivotal role in determining one’s feeding behaviour and nutritional status[[xvi]].Generally, the caregivers were found to have good knowledge and attitudes towards various aspects of human nutrition such as the importance of eating breakfast, the ideal number of meals a child should have a day, and the importance of food variety. However, Shakkour[[xvii]]cautions that good nutritional knowledge and attitudes do not automatically lead to good nutritional practices. In many instances good nutritional practices are hindered by socio-economic constraints such as employment, poverty, and a large number of dependents[[xviii]].Indeed, in this study, the caregivers’ feeding practices were not as good as their nutritional knowledge and attitudes. This observation was clear right from their provision of the first meal of the day – breakfast. Half of the caregivers could not provide their children with breakfast before they go to school or church. Skipping breakfast is not a good nutritional practice, because of its association with poor performance of children at school and numerous health risks[[xix],[xx],[xxi]].
Consumption of breakfast makes an important contribution to a day’s nutrient intake, yet skipping breakfast is a common practice among adolescents[[xxii]].Parents have an important role to play in influencing their children’s breakfast eating patterns[[xxiii]].Breakfast is one of many meals that were skipped by the caregivers’ children understudy. Ideally, children aged 5-14 should have at least three meals a day and a snack in-between[[xxiv]].However, in this study, only 39.5% of the caregivers’ households could afford the above prescribed number of meals. Equally of concern is the quality of consumed meals in the face of the revelation that over half of the caregivers’ households found it difficult to provide a variety of meals to their children. A wide variety of meals is likely to provide a wide range of nutrients that are necessary for a child’s good nutritional status, health and performance at school. This view is widely held by many in the literature[[xxv],[xxvi],[xxvii]].
The caregivers’ inabilities in providing a variety of meals to their children is reflected on their households’ low FVS. Most the caregivers’ households provided meals that were dominated by carbohydrates-rich maize products such as stiff pap, crumbed maize meal, samp and amarhewu, and wheat-based products such as steamed bread and baked bread. It was, therefore, not surprising that in this study the `cereal, roots and tubers’ food group had the highest FVS.
On the other hand, it is commendable that most of the caregivers’ households had a conservatively high DDS. This high DDS came as a result of consumption of few food items on a wide range of the nine food groups. This eating pattern is unlikely to lead to adequate nutrient intake and good nutritional status due to exclusion of critically important nutrients in the feeding menu. A wide range of fruit, which provide a good source of minerals and vitamins, was either rarely consumed or not consumed in many households. Apples and citrus were two most consumed fruits, but their consumption was limited to approximately half of the 263 households that were included in this study. Consumption of bananas was expected to be high by virtue of the proximity of the studied population and local retail shops to banana plantations of the province of KwaZulu-Natal. Banana consumption was reported in only 28.57% of the caregivers’ households. It appears that physical availability of this food item was not a problem, but its financial accessibility[[xxviii]].
FVS and DDS which are indicative of the farming households’ nutritional status were influenced by a number of socio-economic factors. First and foremost, the caregivers’ level of education had a significant influence on FVS (p ≤ 0.05) than on DDS (p ≥ 0.05).Probably, higher level of education of caregivers played a critical role in exposing them to good nutritional and caring practices for their children. Similar observations were also made by some authors[[xxix], [xxx]], while others could not find a relationship between parents’ level of education and their children’s nutritional status[[xxxi]].
Further analysis of results showed that the caregivers’ level of education had a significant effect (p ≤ 0.05) on their households’ monthly non-farm income and expenditure on food. The monthly non-farm income was positively strongly correlated to food expenditure (r=0.55, p<0.01).In turn, food expenditure had a significant influence on FVS (r=0.672; p<0.01) and DDS (r=0.322; p<0.01).These economic variables also had a significant influence on the anthropometric parameters of WAZ, HAZ and BMIZ which are also indicative of nutritional status. These findings on the economic variables (income and food expenditure) are similar to those reported in a survey that was conducted by ECSECC at Alfred Nzo District[[xxxii]].The survey found that most of the monthly expenditure is used to acquire non-durable goods like food, while very little is used to buy either durable or semi-durable goods. For example, in 2013 from a total household income of $811 million, $724 million was used in household expenditure. ECSECC concluded that this elevated household expenditure is symptomatic of poverty in the district, as high expenditure on non-durable goods does very little contribution to wealth creation.
With respect to anthropometric nutritional status, South African communities are reportedly sandwiched between malnutrition, and overweight /obesity[[xxxiii]].In the current study, majority of children had good nutritional status, because they had normal WAZ, HAZ and BMIZ. Very few had low nutritional status through being wasted and stunted. However, among children aged 5-8 years, the prevalence of underweight was 20%, which is indicative of low nutritional status. In terms of the prevalence of various anthropometric conditions, this study found risk of overweight / overweight / obesity a more threatening problem than malnutrition is. Possibly, the high prevalence of these anthropometric conditions was caused by high consumption of carbohydrates-rich food items from the `cereal, roots and tubers’ food group and lack of physical activity.
Conclusion
Whilst the caregivers were found to have good nutritional knowledge, in reality they followed modest feeding practices for their children. Their feeding practices were characterized by high consumption of carbohydrates-rich food items, low FVS and debatably high DDS which are indicative of low to moderate nutritional status. On the anthropometric scale, the majority of children had normal body weight which translated to a good nutritional status. Staple food production-based food security programmes need to be reviewed in favor of the nutrition dimension.
This study recommends diversification of food production and nutrition education as means to improving nutrition security / nutritional status of children from agri-business families. Furthermore, standard procedures and methods into assessing nutrition security / nutritional status should be used. Currently, many previously disadvantaged agri-business families are presumed food and nutrition insecure, and the awarding of government food production subsidies is based solely on this historical misfortunes. There is also a need to evaluate nutrition security / nutritional status of families of relatively bigger and well-established agri-business owners / managers.
In recognition of this study’s limitations, it is advisable that caution be exercised when generalizing its findings to children from previously disadvantaged agri-business families outside the Eastern Cape Province as agricultural performance of agri-business units in other provinces may differ. Eating behavior is also expected to vary, subject to socio-economic conditions.
References:
- Integrated Food Security Strategy for South Africa (2002) Pretoria: Government Printer.
- Dirwayi TP (2010) Application of the sustainable livelihoods framework to the analysis of the provincial growth and development plan of the Eastern Cape: a case study of the Massive Food Production Programme in Nkonkobe Municipality and Buffalo City Municipality. Masters’ degree thesis. Alice: University of Fort Hare.
- Tregurtha N (2012) Inequality and economic marginalisation: review of the Eastern Cape’s Siyakhula / Massive Maize Project. Pretoria: Trade and Industrial Policy Strategies.
- Ndhleve S, Musemva L, Zhou L (2013) Household food security in a coastal rural community of South Africa: status, causes and coping strategies. African Journal of Agricultural and Food Security 1: 15-20.
- Oni SA, Maliwichi LL, Obadira OS (2010) Assessing the contribution of smallholder irrigation to household food security in comparison to dryland farming in Vhembe District of Limpopo Province, South Africa. African Journal of Agricultural Research 6: 2188-2197.
- Kahsay S, Mulugeta M (2014) Determinants of rural household food security in Laelay Maichew Woreda Tigray, Ethiopia. African Journal of Agriculture and Food Security 2: 106-112.
- Pingali P (2015) Agricultural policy and nutrition outcomes – getting beyond the pre-occupation with staple grains. Food Security 7: 583-591.
- Oldewage-Theron WH, Kruger R (2008) Food variety and dietary diversity as indicators of the dietary adequacy and health status of an elderly population in Sharpeville, South Africa. Journal of Nutrition for the Elderly 27: 101-133.
- Labadarios D, Steyn NP, Nel J (2011) How diverse is the diet of adult South Africans? Nutrition Journal 10: 1-5.
- Wellman N S, Kamp B J (2008). Nutrition and ageing. In: Mahan LK ,Escot SSK (ed), Food, nutrition and diet therapy. 12th ed. Philadelphia, Pennsylvania: W B. Saunders Company.
- Wenhold F, Faber M (2012) Nutritional status of South African and strategies to address malnutrition. In: Oelofse A, Van Averbeke W (ed), Nutritional value and water use of African leafy vegetables for improved livelihoods. Report to the Water Research Commission & Department of Agriculture, Forestry & Fisheries. WRC Report No TT 535/12: Pretoria.
- Wrieden W, Pearce H, Armstrong J, Barton K (2003) A short review of dietary assessment methods used in National and Scottish Research Studies. Briefing paper prepared for: Working Group on Monitoring Scottish Dietary Targets Workshop.
- Ruel MT, Menon P (2002) Child feeding practices are associated with child nutritional status in Latin America: innovative uses of the demographic and health surveys. Journal Nutrition 132:1180-1187.
- Kennedy G, Ballard T, Dop M (2011) Guidelines for measuring household and individual dietary diversity: revised version. Rome, Italy: FAO.
- World Health Organisation (2014) Physical status: the use and interpretation of anthropometry technical report series No. 854. WHO: Geneva, 1995.
- Yabanci N, Kisaç Î, Karakus SS (2014) Procedia – Social and Behavioral Sciences 116: 4477-4481.
- Shakkour E (2007) The relationship between nutritional knowledge and application. Honors thesis, Lynchburg: Liberty University.
- Naser AI, Jalil R, Muda WM, Nik WS, Shariff M, et al. (2014) Association between household food insecurity and nutritional outcomes among children in Northeastern of Peninsular Malaysia. Nutrition Research Practice 8: 4–11.
- Hahoney CR, Taylor HA, Kanarek RB, Samuel P (2005) Effect of breakfast composition on cognitive processes in elementary school children. Physiology and Behavior 85: 635-645.
- Min C, Noh H, Kang YS, Sim HJ, Baik HW, et al. (2011) Skipping breakfast is associated with diet quality and metabolic syndrome risk factors of adults. Food Science and Human Nutrition 5: 455-463.
- Mekary RA, Giovannucci E, Cahill L, Willett WC, van Dam RM, et al. (2013) Eating patterns and type 2 diabetes risk in older women: breakfast consumption and eating frequency. American Journal of Clinical Nutrition 98: 436-443.
- Gross SM, Bronner Y, Welch C, Dewberry-Moore MS, Paige DM (2014) Breakfast and lunch meal skipping patterns among fourth-grade children from selected public schools in urban, suburban and rural Maryland. Journal of the American Dietetic Association 104: 420-423.
- Salvy SJ, Elmo A, Nitecki L, Kluczynski MA, Roemmich JN (2011) Influence of parents and friends on children’s and adolescents’ food intake and food selection. American Journal of Clinical Nutrition 93: 87-92.
- Macdiamid J, Loe J, Craig LC, Masson LF, Holmes B, et al. (2009) Meal and snacking patterns of school aged children in Scotland. European Journal of Clinical Nutrition 63: 1297-1304.
- Ruel M (2002) Is dietary diversity an indicator of food security or dietary quality? A review of measurement issues and research needs. Food Consumption and Nutrition Division Discussion Paper No. 140. International Food Policy Research Institute: Washington, United States of America. 24: 231-232.
- Bezerra IN, Sichieri R (2011) Household food diversity and nutritional status among adults in Brazil. International Journal of Behavioral Nutrition and Physical Activity 8: 1-7.
- Thornston AJ (2016) Dietary diversity and food security in South Africa: an application using NIDS Wave 1. Masters degree thesis, Cape Town: University of Cape Town.
- Buyene F, Muche M (2010) Determinants of food security among rural households of Central Ethiopia: an empirical analysis. Quarterly Journal of International Agriculture 49: 299-318.
- Kunwar R, Pillai PB (2002) Impact of education of parents on nutritional status of primary school children. Medical Journal Armed Forces India 58: 38-43.
- Abuya BA, Ciera J, Kimani-Murage E (2012) Effect of mother’s education on child’s nutritional status in the slums of Nairobi. BMC Pediatrics 12: 2-10.
- Alalaq H, Katuli S, Beeson L, Ormsby G, Cordero-MacItyre Z (2012) Parents education and children nutritional status aged 2 to 5 in Zambia. The FASEB Journal 28: 1-12.
- Eastern Cape Socio-Economic Consultative Council (2013) Alfred Nzo District Municipality Socio-Economic Profile, East London: Eastern Cape Socio-Economic Consultative Council.
- Van Graan AE, Bopape M, Phooko D, Bourne L, Wright HH (2013) Drink lots of clean, safe water: a food-based dietary guideline for South Africa. South African Journal of Clinical Nutrition 26: S77-S86.
